Sketch the graph of the function. Indicate where it is increasing and where it is decreasing. Indicate where any relative extrema occur, where asymptotes occur, where the graph is concave up and where is it concave down, where any points of inflection occur, and where any intercepts occur. f(x) = 

What will be an ideal response?
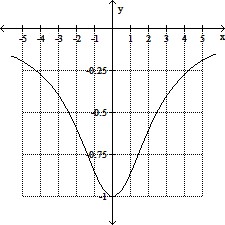
Decreasing on (-?, 0] ; increasing on [0, ?)
Relative minimum at 
Asymptote: y = 0
Concave down on (-?, - ) and (
 , ?); concave up on (-
 ,
,  )
)
Points of inflection:  ,
, 
y-intercept:  ; no x-intercept
You might also like to view...
Use the Comparison Test to determine if the series converges or diverges.
A. diverges B. converges
Solve.The population of a town was about 47,000 in 1910. In 1935, the population was about 83,000. Assuming the exponential model, what was the growth rate of the town, to the nearest hundredth of a percent, during this period?
A. 2.27 % per year B. 4.4 % per year C. 1.26 % per year D. 22.75 % per year
Solve the problem.How much pure acid should be mixed with 7 gallons of a 50% acid solution in order to get an 80% acid solution?
A. 10.5 gal B. 17.5 gal C. 28 gal D. 3.5 gal
Identify the equation as either an identity or not.sin2x - sin2y = cos2y - cos2x
A. Identity B. Not an identity