Refer to the graph below. If the firm is producing at Q1, the area 0BEQ1 represents:
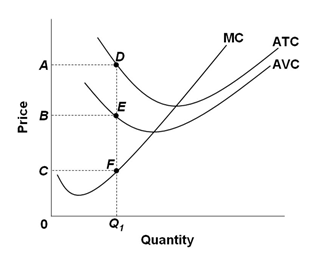
A. Total costs
B. Total variable costs
C. Total fixed costs
D. Average variable costs
B. Total variable costs
You might also like to view...
Consider a firm that produces 500,00 . units per year. The firm's fixed costs are $100,000 . marginal costs are $250 and the price per unit is $400 . In the long-run, how low can price go before it is profitable to shut down?
a. $150 b. $250 c. $250.20 d. $400
Suppose the supply of capital decreases. As a result, the quantity of capital used in production and the rental price of capital will both fall
a. True b. False Indicate whether the statement is true or false
John is an Asian 23-year-old male, and Ken is an Asian 43-year-old male. Both John and Ken are economics majors, and they graduated from the same college with the same GPA — John in 2006 and Ken in 1986 . John and Ken are both financial advisers at the same brokerage firm. John earns $52,000 a year, and Ken earns $88,000 a year. Select the best explanation for this wage difference
a. John has more human capital than Ken. b. John has less human capital than Ken. c. John has been discriminated against because he is young. d. Ken has been discriminated against because he is old.
As productivity in the manufacturing sector increases, the service sector must keep pace or it will become more expensive in the long run.
Answer the following statement true (T) or false (F)