Solve the problem.The following data represents the normal monthly precipitation for a certain city in Arkansas. 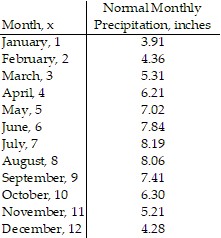 Draw a scatter diagram of the data for one period. Find the sinusoidal function of the form
  that fits the data. Draw the sinusoidal function on the scatter diagram. Use a graphing utility to find the sinusoidal function of best fit. Draw the sinusoidal function of best fit on the scatter diagram.
What will be an ideal response?
y = 2.17 sin (0.49x - 1.88) + 6.02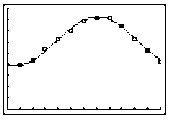
Mathematics
You might also like to view...
Solve the problem.In the analysis of the waveform of an AM radio wave, the equation  arises. Find
  , assuming that the other quantities are constant.
A. 
B. 
C. 
D. 
Mathematics
Evaluate the improper integral or state that it is divergent. 
A. -36 B. 18 C. - 18 D. 0
Mathematics
Use the bar graph to answer the question.The bar graph below shows the number of students by major in the College of Arts and Sciences.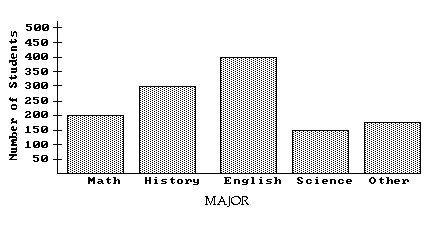 About how many students are in the College of Arts and Sciences?
A. 1100 students B. 1050 students C. 1225 students D. 1325 students
Mathematics
Provide an appropriate response.Is x2 + y2 + 12x + 18y + 53 = 0 the equation of a circle or parabola?
A. Circle B. Parabola
Mathematics