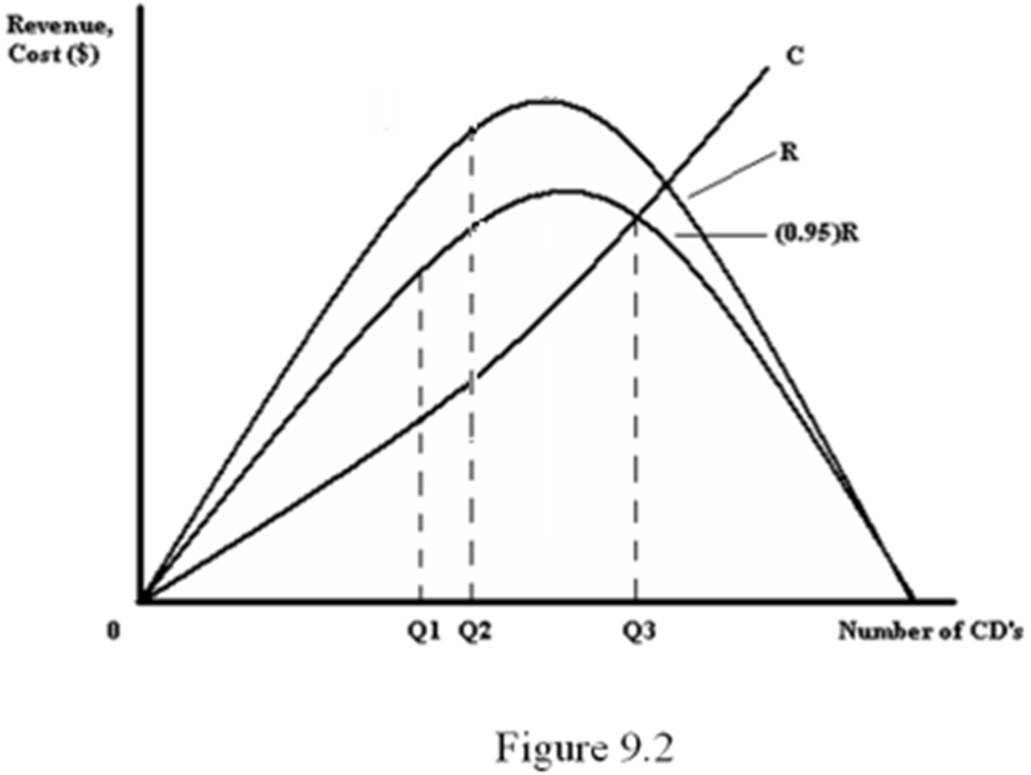
Refer to Figure 9.2. Whenever a CD is sold, 5% of the revenue goes to the artist and the remainder of the revenue goes to the record company. The graph above depicts R, the total revenue from sales; (0.95)R, the record company's share; and C, the cost of producing the CD (which the record companies bears). At what quantity would the record company like to produce the CD?
A. 0
B. Q1
C. Q2
D. Q3
B. Q1
You might also like to view...
Use the following table to answer the next question.YearAltaZornAltaZorn?(Real GDP)(Real GDP)(Population)(Population)1$2,000$150,00020050022,100152,00020250532,200154,000210508Per capita GDP was about
A. $303 in year 3 in Zorn. B. $5 in year 2 in Alta. C. $105 in year 3 in Alta. D. $200 in year 1 in Zorn.
A temporary negative supply shock ________ real interest rates and ________ output in the short run, thereby its effect on stock prices is ________
A) raises; lowers; negative B) raises; raises; ambiguous C) lowers; raises; negative D) lowers; raises; positive
If a bottled soft drink and bottled juice are substitutes, when the price of the bottled soft drink rises
A) demand for bottled juice rises. B) demand for bottled juice falls. C) quantity of bottled juice demanded falls. D) quantity of bottled juice demanded rises.
Refer to the following graphs for a two-sector economy consisting of consumption and investment expenditures. Saving exceeds investment at a real income of _____ and therefore the real income level will _____ toward an equilibrium real income of _____.
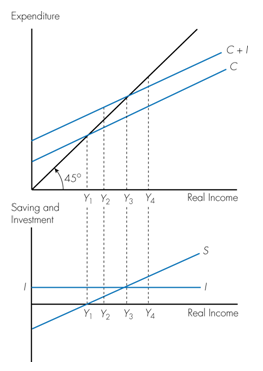
a. Y4; fall; Y3
b. Y2; rise; Y3
c. Y1; rise; Y3
d. Y3; rise; Y4