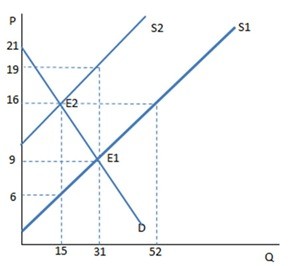
 The graph shown demonstrates a tax on sellers. Which of the following can be said about the effect of this tax?
A. The price paid by buyers is greater than that received by sellers, and the difference is the total tax revenue.
B. The price paid by buyers is greater than that received by sellers, and the difference is the tax wedge.
C. The price paid by buyers and received by sellers is higher than it was before the tax was imposed.
D. The price paid by buyers is less than that received by sellers, and the difference is the total tax revenue.
Answer: B
You might also like to view...
Give examples of factors that decrease aggregate demand. Which way does the aggregate demand curve shift?
What will be an ideal response?
During the stock market boom of the late 1920s stock prices ______
a. rose at about the same rate as dividends b. rose faster than dividends c. rose more slowly than dividends d. there is, surprisingly, not enough information to know what happened to pricesrelative to dividends
An airline can easily move its aircraft from one route to another. One interpretation of this is that the airline industry is an example of a contestable market.
Answer the following statement true (T) or false (F)
Which of the following was one the key factors sending the economy into the Great Recession?
a. declining home prices and rising foreclosure rates b. declining interest rates and declining lending c. declining labor participation rates and rising retirement rate d. none of the above were reasons for the Great Recession