Using Figure 1 above, if the aggregate demand curve shifts from AD2 to AD3 the result in the long run would be: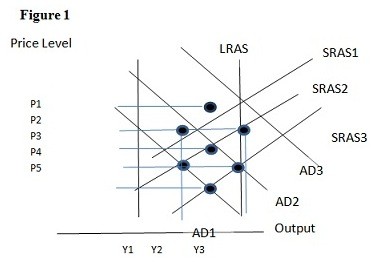
A. P2 and Y2.
B. P1 and Y2.
C. P4 and Y2.
D. P1 and Y1.
Answer: B
You might also like to view...
A rise in the price level produces ________ the potential GDP line
A) a movement downward along B) a leftward shift of C) a rightward shift of D) a movement upward along E) neither a shift of the potential GDP line nor a movement along
A regression specification must include
A) the functional relationship between dependent and explanatory variables. B) the estimated coefficients. C) the estimated t-statistic. D) All of the above.
The multiplier measures the:
A. effect of government spending or tax cuts on national income. B. number of times each dollar is spent in the economy. C. supply of money in the economy. D. effect of household spending on national income.
When will a shortage occur in a market?
a. When the actual price is lower than the equilibrium price b. When quantity supplied is greater than the equilibrium quantity c. When the quantity that consumers are willing and able to purchase decreases d. When the quantity available at zero price is insufficient to meet demand e. When a price floor is set in the market