The demand curve for Widgets is given by QD = 6000 - 2y - 200p + 30pG, where QD is the quantity of widgets demanded, y is the per capita income and pG is the price of Gizmos. Compute the partial derivatives with respect to y and pG
What will be an ideal response?
-2 and +30 respectively
You might also like to view...
Give three examples of ways in which financial markets channel household savings into investment projects
What will be an ideal response?
A curve that shows the wealth distribution for the United States would be:
A. above the Lorenz curve for income. B. below the Lorenz curve for income. C. above the diagonal line. D. equal to the Lorenz curve for income.
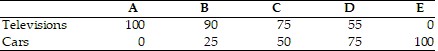 The above table shows the daily production possibilities for a nation. Given the production possibilities schedule in the above table, a combination of 75 televisions and 75 cars
A. cannot be produced by society, given its current level of resources and production technology. B. is attainable but involves the unemployment of some of society's resources. C. clearly illustrates the trade-off between televisions and cars. D. can be produced only if society is willing to have some of its resources used inefficiently.
The perfectly competitive seller's short-run supply curve is
A) its entire marginal cost curve. B) its marginal revenue curve. C) the part of its marginal cost curve above the average variable cost curve. D) the part of its marginal cost curve above the average total cost curve.