Graph the function.y = 
A. 
B. 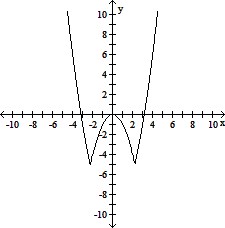
C. 
D. 
Answer: D
You might also like to view...
The following data show the number  , in millions, of Americans with Internet access t years after 1990.
t 7 10 13 16 19 N 46 113 166 177 196?
A: Use logistic regression to model N as a function of t.B: Plot the graph of the data along with the model you found in part A.C: According to the model, what is the maximum number of people who will ever have Internet access? D: When did Internet access reach 123.60 million?
?
Round your answers to two decimal places, if necessary.
, in millions, of Americans with Internet access t years after 1990.
t 7 10 13 16 19 N 46 113 166 177 196?
A: Use logistic regression to model N as a function of t.B: Plot the graph of the data along with the model you found in part A.C: According to the model, what is the maximum number of people who will ever have Internet access? D: When did Internet access reach 123.60 million?
?
Round your answers to two decimal places, if necessary.
What will be an ideal response?
Solve the inequality. Write the solution in interval notation and graph the solution set.8 - 3(2 - x) ? -7![]()
A. [-3, ?)![]()
B. (-?, -2]![]()
C. (-?, -3)![]()
D. (-?, -3]![]()
Divide as indicated. Write the quotient in standard form.
A.  +
+  i
i
B. -  +
+  i
i
C. -  +
+  i
i
D.  -
-  i
i
If  , find sin(-?).
What will be an ideal response?