Solve the problem.The following table shows the per capita fish consumption, in pounds, in the Virgin Islands in 3 recent years. 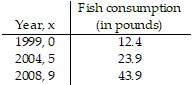 Fit a quadratic function f(x) = ax2 + bx + c to the data. Using this function, what would you predict the per capita fish consumption to be in 2016?
A. 113.1 pounds
B. 114.2 pounds
C. 112.7 pounds
D. 110.4 pounds
Answer: C
You might also like to view...
Find the standard deviation s for the given data. Round your answer to one more decimal place than the original data.The manager of a small dry cleaner employs six people. As part of their personnel file, she asked each one to record to the nearest one-tenth of a mile the distance they travel one way from home to work. The six distances are listed below:17.6?15.4?43.4?46.3?18.5?24.7Compute the standard deviation(s).
A. 4587.1 B. 5526.5 C. 13.71 D. 44.9
Solve the problem.A small farm field is a square measuring 290 ft. on a side. What is the perimeter of the field? If you double the length of each side of the field, what is the new perimeter?
A. 1160 ft., 2320 ft. B. 580 ft., 2320 ft. C. 580 ft., 1160 ft. D. 290 ft., 1160 ft.
Subtract.3x7 + 3x6 - 5x5 + 9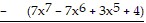
A. 10x7 - 4x6 - 2x5 + 5 B. 10x7 - 4x6 - 2x5 + 13 C. -4x7 - 4x6 - 2x5 + 13 D. -4x7 + 10x6 - 8x5 + 5
Match the graph to the function listed whose graph most resembles the one given.![]()
A. constant function B. linear function C. reciprocal function D. absolute value function