Graph y = f(x) and y = |f(x)| in the standard viewing rectangle. Determine the x-intercept for the graph of y = |f(x)|.y = 3x - 4.2
A. 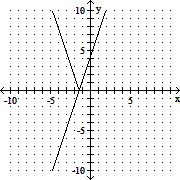
x-intercept is -1.4.
B. 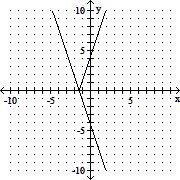
x-intercept is -1.4.
C. 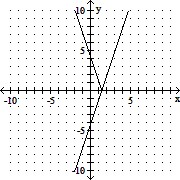
x-intercept is 1.4.
D. 
x-intercept is 0.
Answer: C
You might also like to view...
The result of a hypothesis is described in terms of the probability of obtaining a particular sample. Use the given context to formulate the null and alternative hypotheses. Discuss whether the sample provides evidence for rejecting the null hypothesis.A public bus company official claims that the mean waiting time for bus number 14 during peak hours is only  Karen finds this hard to believe as she seems to be invariably late for work. For 42 randomly selected days, her mean waiting time for bus 14 during peak hours was 11.3 minutes. Assuming that the population mean waiting time is 10 minutes , the probability of selecting a random sample with a mean waiting time of 11.3
minutes or more is 0.0026. What will be an ideal response?
Find a 95% confidence interval for the true population proportion.In a survey of 352 adults, 55% said that they favored the proposed environmental laws.
A. 52.3% to 57.7% B. 49.7% to 60.3% C. 54.7% to 55.3% D. 55% to 60.3%
Find the cost, including a sales charge of $1 per bond, for the transaction.Bond: FPCLast Price: 82.125Number Purchased: 10
A. $82,125.00 B. $8,222.50 C. $8,212.50 D. $9,990.00
Factor completely. If the polynomial cannot be factored, say it is prime.x4 - 13x2 + 36
A. (x2 - 4)(x2 - 9) B. (x2 + 4)(x2 + 1) C. (x2 + 4)(x2 - 9) D. Prime