Refer to the information provided in Figure 28.4 below to answer the question(s) that follow.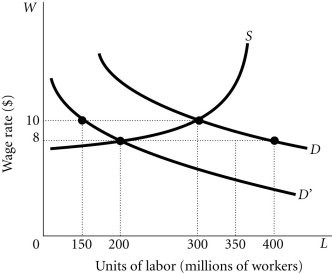 Figure 28.4Refer to Figure 28.4. Suppose there is a decrease in the fertility rate and this causes some men and women to place a lower value on their time spent in nonmarket activities. This will cause
A. the labor supply curve to shift to the right of S.
B. the labor supply curve to shift to the left of S.
C. the labor demand curve to shift from D to D'.
D. the labor demand curve to shift from D' to D.
Answer: A
You might also like to view...
Starting from long-run equilibrium, a war that raises government purchases results in ________ output in the short run and ________ output in the long run.
A. lower; potential B. higher; potential C. higher; higher D. lower; higher
Most food products have low income and price elasticities of demand
Indicate whether the statement is true or false
Explain how product liability laws can reduce adverse selection
What will be an ideal response?
In an auction where the bidders values are $400, $500, $650, $800 and $850, the highest two bidders form a bid-rigging cartel. What would have the winning bid been if there was no cartel?
a. $501 b. $651 c. $801 d. $846