Refer to the diagrams for two separate product markets. Assume that society's optimal level of output in each market is Q 0 and that government purposely shifts the market supply curve from S to S 1 in diagram (a) on the left and from S to S 2 in
diagram (b) on the right. We can conclude that the government is correcting for:
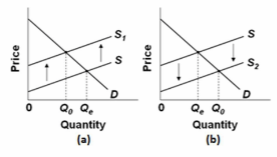
A. negative externalities in diagram (a) and positive externalities in diagram (b).
B. positive externalities in diagram (a) and negative externalities in diagram (b).
C. negative externalities in both diagrams.
D. positive externalities in both diagrams.
A. negative externalities in diagram (a) and positive externalities in diagram (b).
You might also like to view...
Suppose that demand for a product falls, but prices are sticky. What is likely to happen to prices and output in that market, in the short run?
What will be an ideal response?
In an iron and steel plant with 4 blast furnaces, 40 laborers produce 160 tons of pig iron every day. The labor productivity in the firm is equal to _____
a. 0.25 ton per worker b. 4 tons per worker c. 10 tons per worker d. 0.1 ton per worker e. 40 tons per worker
Returns to scale refers to
A. what happens to output when all inputs are varied in some proportion. B. what happens to output when all inputs are held fixed. C. the law of diminishing returns. D. what happens to output when at least one input is fixed and one is varied.
An increase in the costs of production will cause the:
A. long-run aggregate supply curve to shift to the left. B. aggregate demand curve to shift to the right. C. short-run aggregate supply curve to shift to the left. D. short-run aggregate supply curve to shift to the right.