Plot and interpret the appropriate scatter diagram.The table shows the study times and test scores for a number of students. Draw a scatter plot of score versus time treating time as the independent variable. 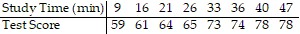

What will be an ideal response?
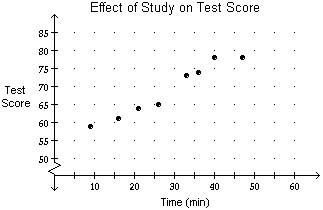
More time spent studying may increase test scores.
You might also like to view...
Identify the critical points. Then use the test of your choice to decide which critical points give a local maximum value and which give a local minimum value. Give these values.f(?) = cos 2?, 0 < ? < 
A. Critical point:  ; local maximum f
 =
= 
B. Critical point: 0; local minimum f(0) = -1
C. No critical points; no local maxima or minima on the interval 
D. Critical points: 0,  ; local maximum f(0) = 1; local minimum f
 = 0
= 0
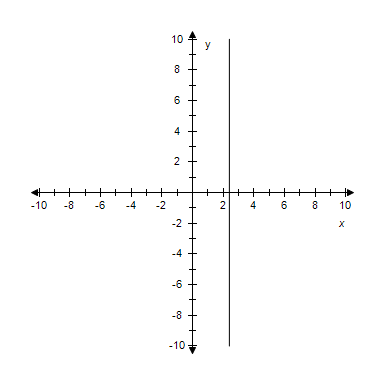
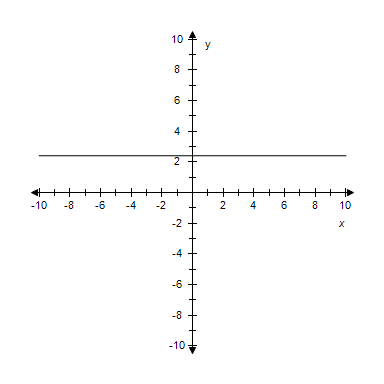
Solve the problem.If a circle of radius 5 is made to roll along the x-axis, what is the equation for the path of the center of the circle?
A. y = 0 B. x = 5 C. y = 5 D. y = 10
List all numbers from the given set that are members of the given Real Number subset.{16,  , -22, 0, 0.
 ,
,  } Integers
A. 16, -22, 0, 
B. 16, -22, 0
C. 16, 0
D. 16, 0, 
Find the slope-intercept form of the equation of the line that passes through the given point and has the indicated slope m. Select correct answer for the line. ? P(2.4, -8.7), m = -4 ?
A. x = 2.4y + 0.9

B. x = 2.4
C. y = 2.4
?
D. y = -4x + 0.9
 ?
?
E. y = 2.4x + 0.9
