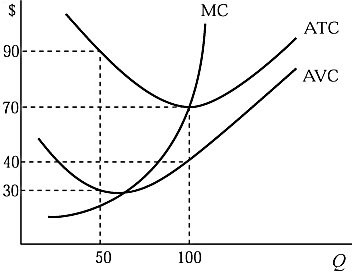
 Figure 5.4 shows a firm's marginal cost, average total cost, and average variable cost curves. At Q = 50, the total cost is:
A. $2,100.
B. $2,800.
C. $4,500.
D. $6,300.
Answer: C
You might also like to view...
The demand curve is:
A. a downward-sloping line that reflects the inverse relationship between price and quantity. B. an upward-sloping line that reflects the inverse relationship between price and quantity. C. a downward-sloping line that reflects the positive relationship between price and quantity. D. an upward-sloping line that reflects the direct relationship between price and quantity.
The Fed is part of the executive branch of the federal government
a. True b. False Indicate whether the statement is true or false
The sum of the balances in the current and capital accounts in the balance of payments must equal zero
Indicate whether the statement is true or false
Dollar depreciation raises United States Real GDP when the __________ shift of the AD curve exceeds the _________________ shift of the SRAS curve
A) rightward; rightward B) rightward; leftward C) leftward; rightward D) leftward; leftward