Using the above table, moving from alternative C to alternative B, what is the opportunity cost of one loaf of bread?
A) 1 pizza pie
B) 30 pizza pies
C) 2 pizza pies
D) 0.5 pizza pie
D
You might also like to view...
Refer to Figure 18-6. Which country has the more unequal distribution of income?
A) Syldavia B) Islandia C) They may have the same absolute income distribution although their relative income distribution is different. D) There is insufficient information to answer the question.
If quantity supplied is either greater or less than the equilibrium quantity, then all of the following are true except:
a. total loss of surplus will depend on the shape of the demand and supply curves. b. the resulting loss of consumer surplus will depend on the price of the good. c. total loss of surplus will depend on the price of the good. d. there will be an inefficient allocation of resources.
In this graph, what does point A show?
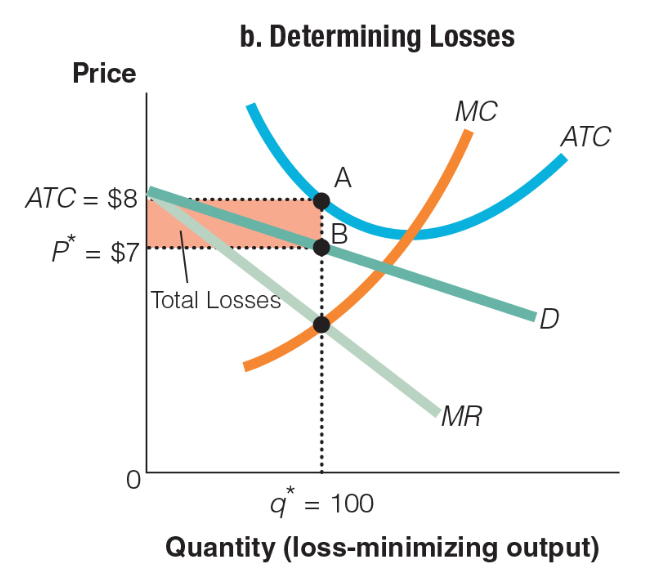
a. the average total cost at the equilibrium quantity
b. the average total cost at zero quantity
c. the demand at the equilibrium quantity
d. the demand at zero quantity
Personal income tax rates being tied to the overall price level leads to fiscal drag.
Answer the following statement true (T) or false (F)