Exhibit 3-3 Demand curves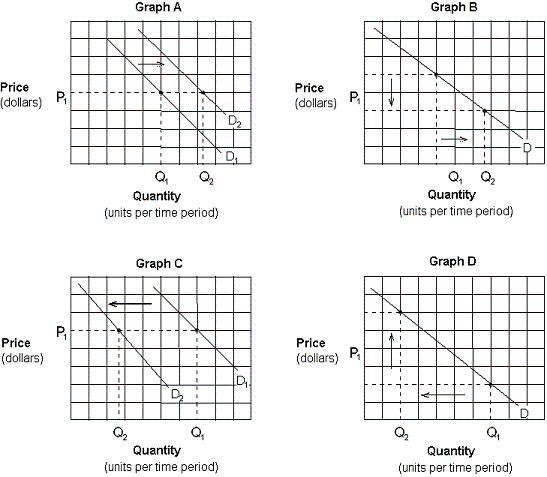
Assume that consumers expect the price of gasoline to rise sharply in the future. Which of the graphs in Exhibit 3-3 depicts this effect?
A. Graph A.
B. Graph B.
C. Graph C.
D. Graph D.
Answer: A
You might also like to view...
The market demand curve for a good is found by
a. adding up the quantities demanded by all consumers at different prices of that good b. adding up the quantities demanded by all consumers at different incomes c. adding up the maximum price each consumer is willing to pay for each possible quantity of the good d. varying consumers' total income and determining what prices they are willing to pay e. vertically summing the individual consumers' demand curves
When a country allows trade and becomes an importer of a good,
a. both domestic producers and domestic consumers become better off. b. domestic producers become better off, and domestic consumers become worse off. c. domestic producers become worse off, and domestic consumers become better off. d. both domestic producers and domestic consumers become worse off.
Open and explicit agreements concerning pricing and output shares transform an oligopoly into a
A. Differentiated oligopoly. B. Monopoly. C. Perfectly competitive firm. D. Cartel.
Related to the Economics in Practice on page 176: When there are only a few empty cabins on a large cruise ship, the marginal cost of adding extra passengers to occupy those cabins
A. will primarily depend on the number of customers waiting to travel. B. will be negative. C. is probably very low. D. is generally quite high.