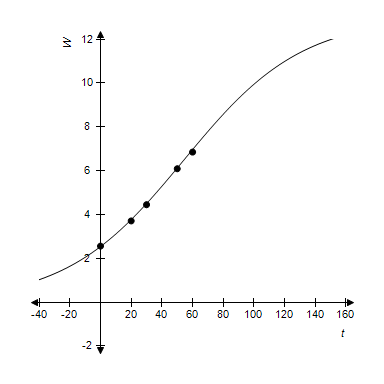
The following data show the world population W, in billions, t years after 1950.
t 0 20 30 50 60 W 2.56 3.71 4.45 6.09 6.85?
A: Use logistic regression to model W as a function of t. Round the r value to three decimal places.B: Plot the graph of the data along with the model you found in part A. Your graph should show the world population up to the year 2100.C: According to the model, when was the world population growing at its fastest rate?
?
Round your answers to two decimal places, if necessary.
What will be an ideal response?

?
B:?
?
C: 54.36 years after 1950
You might also like to view...
Which of the following does not represent the concept of surface area? ?
A. ?The visible surface you can see. B. ?The area of each visible surface. C. ?The space the shape takes up. D. ?S = 2wl + 2wh + 2lh E. S = 2(wh + wl + hl)?
Indicate the metric unit of measurement that would be best used to express the area of the object.A theme park
A. square centimeters B. square kilometers C. square millimeters D. square meters
Solve the problem.Persons taking a 30-hour review course to prepare for a standardized exam average a score of 620 on that exam. Persons taking a 70-hour review course average a score of 809. Find a linear equation which fits this data, and which relates score to review time. Use this equation to predict an average score for persons taking a 50-hour review course. Round your answer to the tenths place.
A. 718.7 B. 707.2 C. 728.5 D. 714.5
Express in simplified form. Assume that all variables represent positive real numbers.
A. 
B. 
C. 
D. 