Find the first and second derivatives of the function.
?
What will be an ideal response?
 ,
, 
You might also like to view...
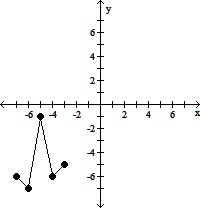
The stack plot below shows the value of each of Danny's investments. The stack plot contains three regions. The uppermost unshaded region represents the value of Danny's investment in individual stocks. The center shaded region represents the value of Danny's investment in mutual funds and the bottom region in black represents the value of Danny's investment in a CD. The thickness of a region at a particular time tells you its value at that time.  Use the graph to answer the question.In which year was the value of Danny's investment in individual stocks the least?
A. year 0 B. year 7 C. year 1 D. year 8
Find the derivative of the function.y = log |8 - x|
A. - 
B. 
C. - 
D. - 
Check the addition. If the answer is incorrect, find the correct answer. 7495
7495
A. Incorrect; should be 7605 B. Incorrect; should be 7505 C. Correct D. Incorrect; should be 7506
Use the table of xy-values to make a line graph.
A. 
B. 
C. 
D.