In Figure 2.1, Box 1 would be labeled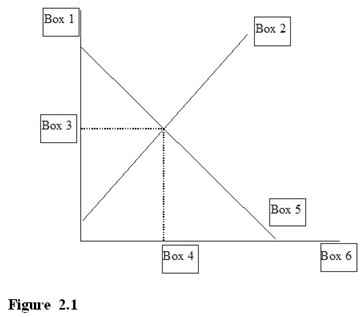
A. P for price.
B. S for supply.
C. D for demand.
D. P* for equilibrium price.
Answer: A
You might also like to view...
What is measured on the horizontal axis when we draw a graph of the long-run aggregate supply curve?
A) production of consumer goods B) real GDP C) production of capital goods D) the price level
What is the law of supply? What does this law imply about the shape of the supply curve?
What will be an ideal response?
Why is the pricing outcome of a perfectly competitive firm efficient in economic sense?
What will be an ideal response?
If goods A and B are substitute goods, then an increase in the price of B, other things being equal,
A. decreases the quantity demanded of B, but has no effect on the amount of A consumed. B. has no real effect on the quantity demanded of good B, but increases the demand for A. C. results in a decrease in the amounts of both A and B consumed. D. results in a decrease in the quantity of B consumed, but increases the demand for A.