Refer to the graphs below. They show the long-run average total cost (LRATC) for cars. For which graph are there economies of scale throughout the entire range of output of cars?
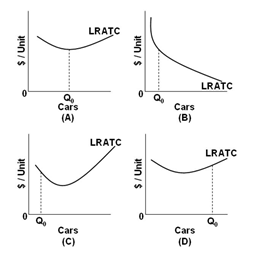
A. Graph A
B. Graph B
C. Graph C
D. Graph D
B. Graph B
You might also like to view...
Free trade may be good for a nation, but not for everyone in the nation. Explain why free trade is controversial and the list the justifications that proponents of trade adjustment assistance offer in support of those policies
What will be an ideal response?
The aggregate supply curve is the relationship between the price level and the quantity of real GDP purchased
a. True b. False Indicate whether the statement is true or false
The gains from general training in human capital tend to go to the
A. individual and not to the employing firm. B. federal government in the form of higher taxes. C. parents since they paid for the education in the first place. D. employing firm and not to the individual.
In a market economy,
a. resources are distributed equally across the all possible uses. b. resources move to higher valued uses in response to changes in price. c. resource usage is independent of the price. d. most resources are distributed by the government. e. all of the above.