Use the graph of a quadratic function to find the solution set of the equation or inequality. For a solution set that involves an interval, use interval notation.-x2 - 5x - 11 = 0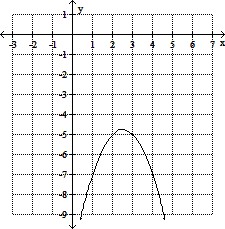
A. x = 11
B. (-?, 11) ? (11, ?)
C. (-?, ?)
D. ?
Answer: D
You might also like to view...
Evaluate.-2n0
A. 2 B. -1 C. 1 D. -2
Evaluate the expression. -3
-3
A. - 27
B. 
C. - 
D. 27
State the multiplication property illustrated by the given equation.0(-198) = 0
A. Identity B. Zero C. Commutative D. Distributive
Solve the problem.Economists use what is called a Leffer curve to predict the government revenue for tax rates from 0% to 100%. Economists agree that the end points of the curve generate 0 revenue, but disagree on the tax rate that produces the maximum revenue. Suppose an economist produces this rational function 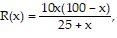 where R is revenue in millions at a tax rate of x percent. Use a graphing calculator to graph the function. What tax rate produces the maximum revenue? What is the maximum revenue?
A. 28.8%; $272 million B. 38.4%; $383 million C. 27.0%; $379 million D. 30.9%; $382 million