Provide an appropriate response.Suppose that you want to construct a graph to represent the following data. 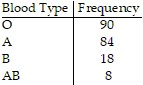 If you are primarily interested in the number of people in each category as a percentage of the total number of people, would a bar chart or a pie chart be more useful? Explain your thinking.
What will be an ideal response?
Answers will vary. Possible answer: A pie chart would be more useful. A pie chart clearly shows the proportion of the whole "pie" represented by each piece of pie. A bar chart is more useful for comparing the sizes of different categories with each other.
You might also like to view...
Solve the problem.Use a Taylor series to estimate the integral's value to within an error of magnitude less than 10-3.
A. 0.7678 B. 0.3396 C. 0.6944 D. 0.5964
Solve the problem.For the polynomial function f(x) = 2x4 - 7x3 + 11x - 4a) Find the x- and y-intercepts of the graph of f. Round to two decimal places, if necessary.b) Determine whether the graph crosses or touches the x-axis at each x-intercept.c) End behavior: find the power function that the graph of f resembles for large values of |x|.d) Use a graphing utility to graph the function.Approximate the local maxima rounded to two decimal places, if necessary. Approximate the local minima rounded to two decimal places, if necessary.e) Determine the number of turning points on the graph. f) Put all the information together, and connect the points with a smooth, continuous curve to obtain the graph of f. 
style="vertical-align: 0.0px;" height="200" width="200" /> What will be an ideal response?
Given that f(x) = sin x, g(x) = cos x, and h(x) = tan x, evaluate the given function. The point (x,  ), on the circle
  , also lies on the terminal side of an angle ? in quadrant II. The point
  , on the circle
  , also lies on the terminal side of an angle ? in quadrant III.g
style="vertical-align: -17.0px;" />
A. 
B. 
C. 
D. - 
If A ? is an acute angle in a right triangle and cos A= , find tan A. Leave the answer in fraction form.
What will be an ideal response?