Refer to the above figure. The market equilibrium quantity is Q1. Point Q2 represents the optimal amount of production. The government can achieve the optimal outcome by
A) setting the price at P3.
B) providing a per-unit subsidy to consumers equal to P3 - P1.
C) providing a per-unit subsidy to consumers equal to P2 - P1.
D) establishing a tax equal to P2 - P1 per unit of the good sold.
B
You might also like to view...
A firm's total product curve shows
A) that inefficiency is not possible. B) how the cost of the fixed resources change when output changes. C) how the amount of output changes when the quantity of labor changes. D) that in the long run the firm must adjust the quantity of all the resources it employs.
Value added equals the market price of the firm's product minus
A) the price of intermediate goods. B) wages and salaries. C) the price of all factors of production. D) depreciation on plant and equipment.
Which of the following formulas accurately reflects this graph?
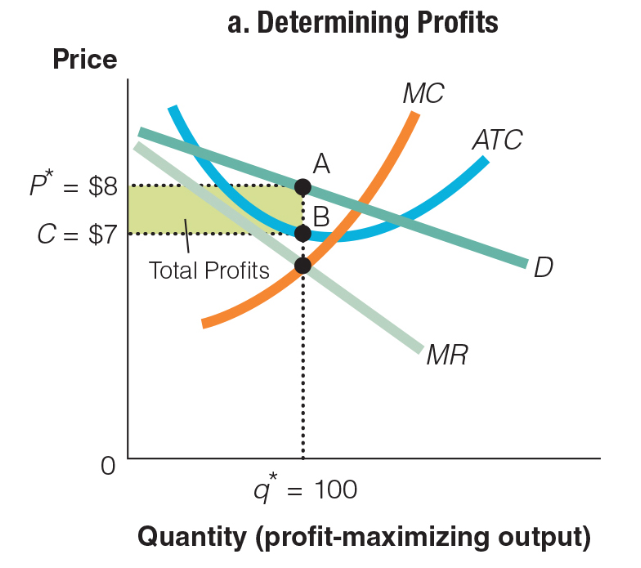
a. P* ($8) ? ATC ($7) ? q* (100) = $100
b. P* ($8) + ATC ($7) ? q* (100) = $1,500
c. P* ($8) ? ATC ($7) ÷ q* (100) = $.01
d. P* ($8) + ATC ($7) ÷ q* (100) = $.15
Exhibit 7-12 Marginal revenue and cost per unit curves
?
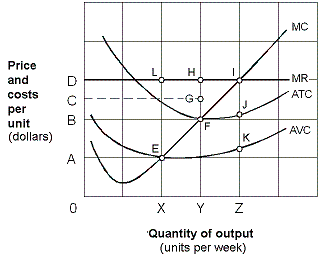 As shown in Exhibit 7-12, the firm will not produce in the short-run if the price is below:
A. OA. B. OB. C. OC. D. OD.