Refer to the graph shown. Assume the market is initially in equilibrium at point b in the graph but the imposition of a per-unit tax on this product shifts the supply curve up from S0 to S1. The amount of revenue government will collect from this tax is equal to the: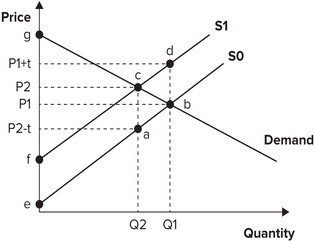
A. area of the triangle bcd.
B. area of the triangle abc.
C. amount of the per-unit tax multiplied by Q1.
D. amount of the per-unit tax multiplied by Q2.
Answer: D
You might also like to view...
Total cost includes
A) the cost of variable resources only. B) the cost of fixed resources only. C) the cost of both variable and fixed resources. D) the cost of neither variable nor fixed resources. E) all explicit costs and all the implicit costs that actually must be paid using money.
Another term for negative externalities is
A) bad vibrations. B) non-marginal costs. C) spillover costs. D) sunk costs. E) surplus product.
From 1950 to 2015 the number of people who lived on farms fell from 23 million to fewer than 3 million? Which of the following factors have contributed to this trend?
A) government policies that have increased the cost of living and working on farms B) increases in the cost of farming and a desire for young adults to move to urban areas C) rapid growth in farm production and low income and price elasticities for food products D) slow growth in agricultural productivity and low income elasticities for food products
Frictional unemployment results from
a. job searching. It is often thought to explain relatively short spells of unemployment. b. job searching. It is often thought to explain relatively long spells of unemployment c. a surplus in the some labor markets. It is often thought to explain relatively short spells of unemployment. d. a surplus in some labor markets. It is often thought to explain relatively long spells of unemployment.