Graph the function f(x) over the given interval. Partition the interval into 4 subintervals of equal length. Then add to your sketch the rectangles associated with the Riemann sum  , using the indicated point in the kth subinterval for ck.f(x) = x2 - 3, [0, 8], midpoint
A. 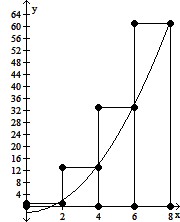
B. 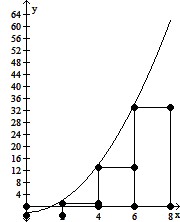
C. 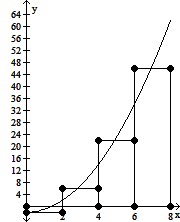
D. 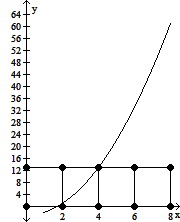
Answer: C
Mathematics
You might also like to view...
Find det A using the method of cofactors.A = 
A. -567 B. 525 C. 567 D. -609
Mathematics
Match the correct function to the graph.
A. y = x - 1
B. y = 
C. y = 
D. y = 
Mathematics
Use graphical methods to find all real solutions to the following equation. Express solutions rounded to the nearest hundredth.x3 + 2x2 - 11x - 22 = 0
A. {2, 3.32, -3.32} B. {-2, 3.32, -3.32} C. {-2, 3.42, -3.42} D. {2, 3.22, -3.22}
Mathematics
Provide an appropriate response.Is the integer 0 positive or negative? Explain.
What will be an ideal response?
Mathematics