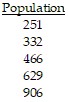
Solve the problem.The population (in hundred thousands) for the Colonial United States in ten-year increments for the years 1700-1780 is given in the table. (Source: 1998 Information Please Almanac)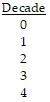 ?
? ?
?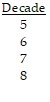 ?
?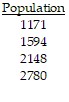 State whether the data can be more accurately modeled using an exponential function or a logarithmic function. Using a graphing utility, find a model for population
(in hundred thousands) as a function of decades since 1700.
What will be an ideal response?
exponential; y = 252.68 ? 1.36x
You might also like to view...
Find the expected value.In a game, you have a  probability of winning
  and a
and a  probability of losing
  What is your expected winning?
A. -$1.36 B. $6.47 C. -$3.91 D. $2.56
Answer as requested.Which of the following is likely a coincidence?
A. More crime in neighborhoods with fewer streetlights B. Higher annual rainfall in states with fewer homicides C. Higher real estate prices in cities with more employment opportunities D. Higher incidence of skin cancer in regions with more sunshine
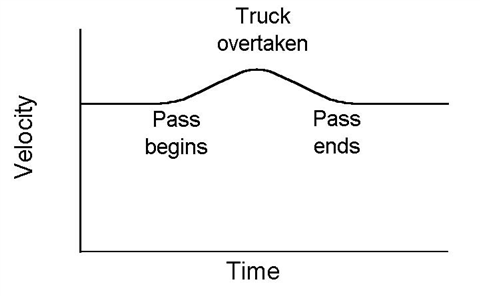
You are driving with your cruise control set when you encounter a slowly moving truck. You speed up to pass the truck. When you have overtaken the truck, you slow down and resume your previous speed. The graph of velocity,  , is shown. Make a graph of
  , the acceleration. Be sure to label
your graph appropriately.
?
 What will be an ideal response?
Solve the system by addition.9x + 4y = -542x - 2y = -12
A. {(-7, 1)} B. {(-6, 1)} C. ? D. {(-6, 0)}