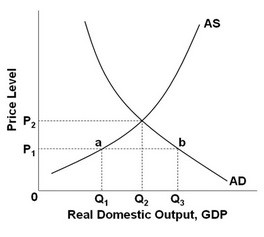
 Refer to the above graph. At price level P1:
A. the quantity of output supplied is equal to the quantity of output demanded.
B. the quantity of output supplied is greater than the quantity of output demanded.
C. the quantity of output supplied is less than the quantity of output demanded.
D. the quantity of output supplied is constant.
Answer: C
You might also like to view...
Explain the relationship between potential GDP and real GDP in the United States since the early 1960s. You do not need to tell what happened during any specific year; just describe the general relationship
What will be an ideal response?
Cost-benefit analysis is the public sector counterpart to ____ used in private, profit-oriented firms
a. ratio analysis b. break-even analysis c. capital budgeting techniques d. economic forecasting e. none of the above
Given the table below, what is average fixed cost when 300 units of output are produced? 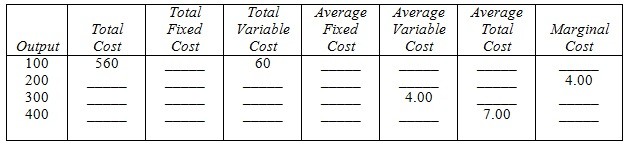
A. $500 B. $160 C. $3.00 D. $0.60 E. none of the above
Briefly discuss the findings of the U.S. Department of Commerce in 2018 that the Chinese government had engaged in unfair policies and practices involving U.S. intellectual property.
What will be an ideal response?