The data in the figure below represents the annual salaries of 120 professional mathematicians.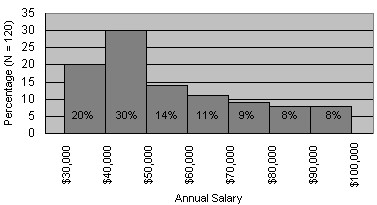
Which of the following values is the best estimate of the standard deviation of this data?
A. $40,000
B. $490,000
C. $5000
D. $70,000
E. $20,000
Answer: E
Mathematics
You might also like to view...
Graph the equation.x2 + y - 4 = 0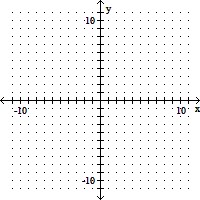
A. 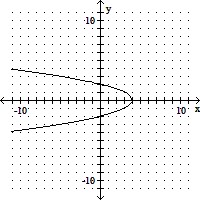
B. 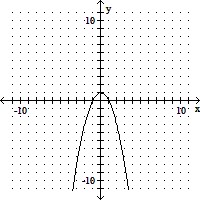
C. 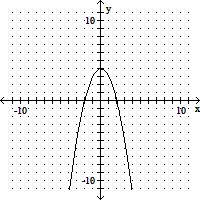
D. 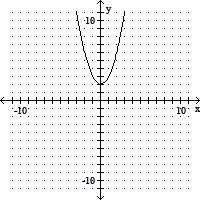
Mathematics
Draw a Venn diagram to represent the given information.Patients in a (hypothetical) hospital on a single day were taking antibiotics (A), blood pressure medication (BP), and pain medication (P) in the following numbers: 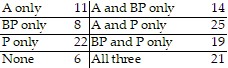 Draw a three-circle Venn diagram that summarizes the results in the table.
A. 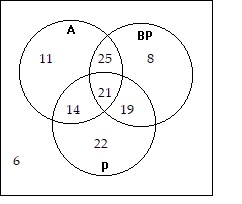
B. 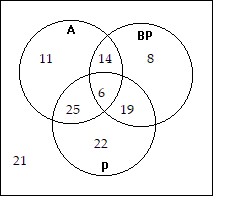
C. 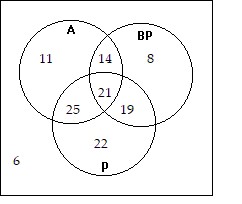
D. 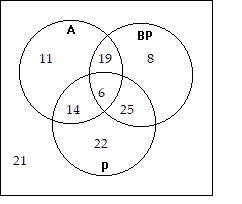
Mathematics
Round the number to the nearest thousandth, nearest hundredth, and nearest tenth. Remember to round from the original number.0.9485
A. 0.949, 0.95, 0.9 B. 0.949, 0.94, 1.0 C. 0.9485, 0.948, 0.94 D. 0.948, 0.94, 0.9
Mathematics
Compute the extension totals and the invoice total.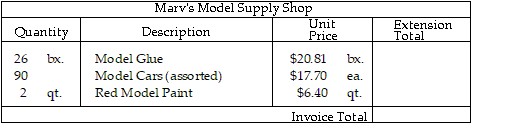
A. 
B. 
C. 
D. 
Mathematics