Determine the inequality which matches the calculator graph. Do not use your calculator. Instead, use your knowledge of the concepts involved in graphing inequalities.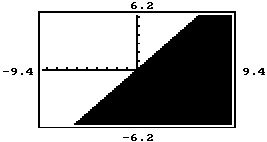
A. y ? x
B. y ? -x
C. y ? x
D. y ? -x
Answer: C
You might also like to view...
Evaluate the cylindrical coordinate integral.
A. 60? B. 20? C. 40 D. 60
Solve the problem.The concentration of alcohol in a person's blood is measurable. Suppose that the risk R (given as a percent) of having an accident while driving a car can be modeled by the equation R = 5ekxwhere x is the variable concentration of alcohol in the blood and k is a constant.Suppose that a concentration of alcohol in the blood of 0.07 results in a 10% risk  of an accident. Find the constant k in the equation.Using this value of k, what is the risk if the concentration is 0.11?
What will be an ideal response?
Solve the variation problem.The amount of water used to take a shower is directly proportional to the amount of time that the shower is in use. A shower lasting 16 minutes requires 8 gallons of water. Find the amount of water used in a shower lasting 6 minutes.
A. 2.5 gallons B. 3 gallons C. 3.5 gallons D. 96 gallons
Determine whether the statement is true or false. If it is true, explain why it is true. If it is false, give an example to show why it is false. ? The least-squares line must pass through at least one data point. ?
A. It is false.
?
Example. Find the least-squares line for the data
?

?
Solution. Here, we have  and
and
?
 |  |  |  |  |
 |  |  |  |  |
?
?
The least-squares line for the data is given by linear equation
?

?
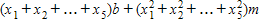
where the constants m and b satisfy the normal equations
?

?
?
?
Then, we obtain the normal equations
?

?
Solving them, we found 
?
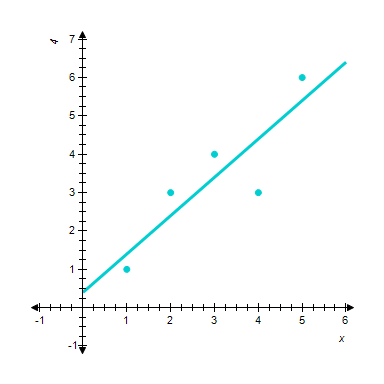
Therefore, the required least-squares line is 
?
The scatter diagram and the least-squares line are shown in the figure. We can see that the line does not pass through any data point.
?
B. It is true
?
Suppose that we are given two data points
?

?
If we try to fit a straight line to these data points, the line will miss the first and the second data points by the amountsd1,d2, respectively.
?

?
The principle of least squares states that the straight line L that fits the data points best is the one chosen by requiring that the sum of the squares
?

?
be made as small as possible. But it is possible only in case when least-squares line passes through at least one data point.