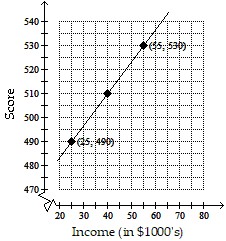
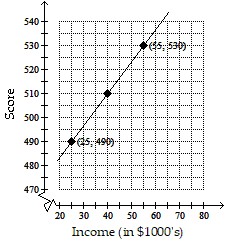
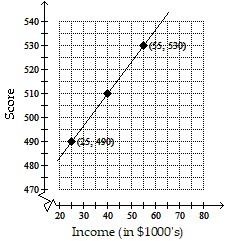
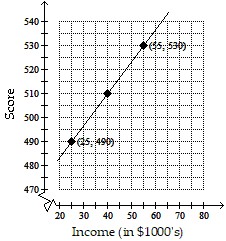
Solve by graphing. Label the axes and show where the solution is located on the graph.The graph depicts a relationship between scores achieved on an unspecified standardized test and family income. Suppose the score for a test is 490 when the family income is $25,000 and is 530 when the family income is $55,000. Let x be the income and y be the score of the test. Graph the two given pairs of incomes and scores. Assume that the relationship is linear. Draw a line though the two previous points. From your graph, estimates the score if the family income is $40,000.
A. 
570
B. 
530
C. 
510
D. 
550
Answer: C
Mathematics
You might also like to view...
List the numbers that precede and follow the given number in the given base.DB216
A. DB16; DB416 B. CA116; CA316 C. CA116; EC316 D. DB116; DB316
Mathematics
Find the linearization of the function at the given point. at
at 
A. 
B. 
C. 
D. 
Mathematics
Any two polygons that are similar to each other are also congruent to each other.
Answer the following statement true (T) or false (F)
Mathematics
Solve the problem.A square yard has a 6-foot wide sidewalk around a square lawn. The sides of the yard, including the sidewalk, have length y. Evaluate for y = 60, the polynomial that gives the area of the sidewalk.
A. 864 B. 1296 C. 1584 D. 684
Mathematics