Which of the following price-quantity data would not be part of the demand curve derived from the graph below? 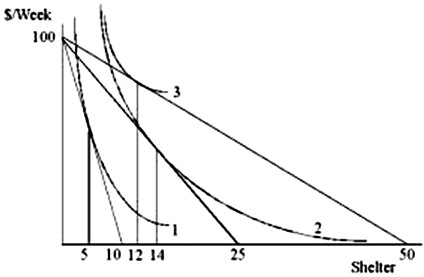
A. Price = 4, quantity = 14
B. Price = 2, quantity = 12
C. Price = 10, quantity = 5
D. Price = 0, quantity = 10
Answer: D
You might also like to view...
According to the table above, ________ percent of total income is redistributed to the lowest income group
A) 4.7 B) 2.3 C) 1.5 D) 3.8
Suppose that a worker in Country A can make either 25 bananas or 5 tomatoes each year. Country A has 200 workers. Suppose a worker in Country B can make either 18 bananas or 6 tomatoes each year. Country B has 400 workers. The opportunity cost of one tomato in Country A is:
A. 100 bananas. B. 20 bananas. C. 5 bananas. D. 4 bananas.
GDP during a period can be calculated by summing either
a. the purchases of domestically produced final goods and services or the cost incurred in the production of those goods. b. the amount received by business firms for consumer goods and services or the spending of business firms on investment goods and services. c. all household expenditures on final goods and services or all business purchases of factors of production. d. sales of goods and services to foreigners or the purchase of goods and services from foreigners
An American investing in a London-based company is an example of interest arbitrage.
a. true b. false