In a normal distribution, what percentage of the population is within 1 SD of the mean? What about within 2 SD?
What will be an ideal response?
A measure of 1 SD above and 1 SD below the mean (±1 SD) includes 68 percent of the population, while ±2 SD includes 95 per-cent of the population. The 5th to 95th percentiles are nearly 2 standard deviations on either side of the mean.
You might also like to view...
Name the views shown on the drawing.
Review drawing number 522923A0A and then answer the following questions.
____________________ after boring provides a much more satisfactory surface for new rings and promotes longer ring life.
Fill in the blank(s) with the appropriate word(s).
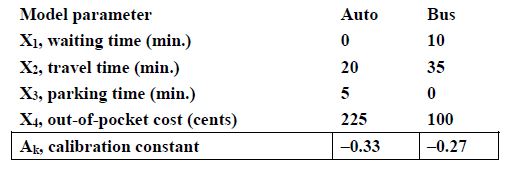
The following utility function was calibrated based on an observed mode split of 84.9% private auto use and 15.1% bus use. Utility function: Uk = Ak – 0.10 X1 – 0.13 X2 – 0.12 X3 – 0.0045 X4 After implementing service improvements to the buses, the mode split changed to 81.6% private auto use and 18.4% bus use. Determine a value for the calibration constant for the bus mode that reflects this shift in mode split.
A mode choice logit model is to be developed based on the following information. A
survey of travelers in an area with bus service found the following data:
What will be an ideal response?
The load capacity of a simple block and tackle is equal to the capacity of the _____
a. sheave b. hook c. load line d. pulley