Of the collection of supply and demand diagrams in Figure 2.2, which one shows the result of an increase in technology in the market for anything?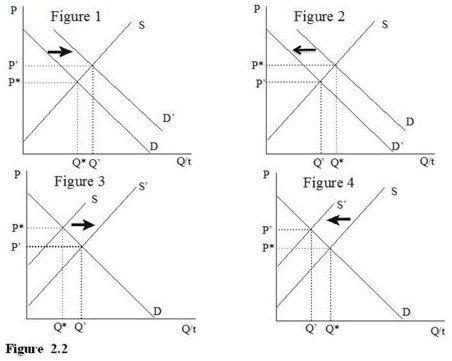
A. Figure 1
B. Figure 2
C. Figure 3
D. Figure 4
Answer: C
You might also like to view...
Suppose you paid $500,000 for an asset. You hold the asset for five years. The interest rate that you get for the asset is 10%. Assume the tax rate on capital gains is 20%.
(A) If capital gains are taxed only when the asset is realized, how much will you have earned on the asset? (B) Suppose that capital gains are taxed annually instead of at realization. How much will you have earned on the asset? (C) How big is the difference in the two taxing schemes?
An increase in default risk on corporate bonds ________ the demand for these bonds, but ________ the demand for default-free bonds, everything else held constant
A) increases; lowers B) lowers; increases C) does not change; greatly increases D) moderately lowers; does not change
The impact on the foreign exchange market for dollars resulting from the Fed selling euros will be:
A. an increase in the supply of dollars. B. a decrease in the supply of dollars. C. a decrease in the interest rate in the U.S. D. a decrease in the demand for dollars.
Which is not a supply factor in economic growth?
A. An efficient allocation of resources. B. Natural resources. C. Technological knowledge. D. The quantity and quality of labor.