This graph represents the cost and revenue curves of a firm in a perfectly competitive market.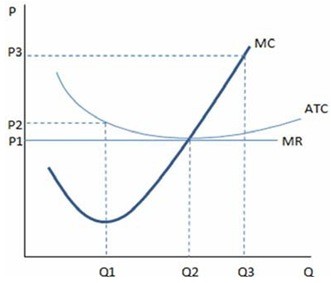 According to the graph shown, if a firm is producing at Q1:
A. the firm should not increase production because it will earn loss.
B. average total costs exceed the market price.
C. marginal revenue is greater than average total cost.
D. profits are being maximized.
Answer: B
You might also like to view...
The size effect and the diffusion effect always occur in isolation
Indicate whether the statement is true or false
How can banks increase the amount of loanable funds available for private lending?
(a) By selling government securities to securities dealers and the Federal Reserve System (b) By buying government securities from securities dealers and the Federal Reserve System (c) By buying stocks, property and other assets to hold on behalf of the banks (d) By holding 100 percent of customers' deposits in bank vaults
Suppose P = 60 ? 3Q is the market demand function for a local monopoly. The marginal cost is 2Q. If fixed costs are zero and the firm engages in two-part pricing, the most profits the firm will earn is:
A. $0. B. $504. C. $360. D. $144.
A polluting company may be able to purchase the right to pollute through
A. Higher user fees. B. Emission charges. C. Pollution permits. D. Pollution fines.