Provide an appropriate response.Sketch a scatter plot for a set of data points for which it would be appropriate to fit a linear function. Then sketch a second scatter plot for a set of data points for which it would not be appropriate to fit a linear function. For the second scatter plot, explain why it would not be reasonable to fit the data points to a linear function.
What will be an ideal response?
Examples will vary. The points in the first scatter plot should be clustered about a straight line. The points in the second scatter plot should be scattered about a curve.
You might also like to view...
Solve graphically the problem to the stated accuracy.A mother is choosing which baby foods to serve her infant. A jar of meat has  of protein and 36 calories. A jar of vegetables has
  of protein and 18 calories. How much of each (to the nearest tenth) will she need to serve to get
  of protein and 109 calories?
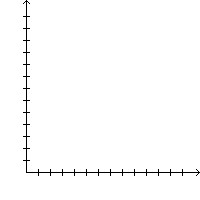
A. 1.5 jars of meat and 2.0 jars of vegetables B. 2.0 jars of meat and 1.5 jars of vegetables C. There are infinitely many such combinations. D. There is no such combination.
Find the cardinal number for the set.B = {x | x is a number on a clock face}
A. n(B) = 6 B. n(B) = 3 C. n(B) = 24 D. n(B) = 12
Find the quotient.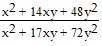 ÷
÷ 
A. 
B. 
C. 
D. x - 6y
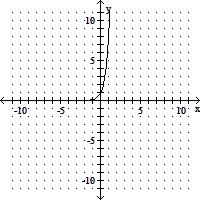
Sketch the graph of the given function.f(x) = 12( )x
)x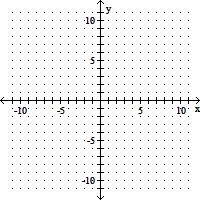
A. 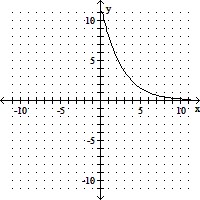
B. 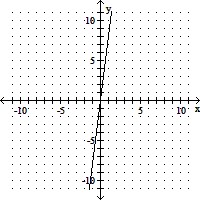
C. 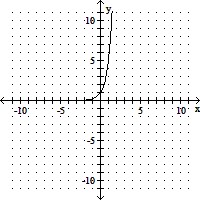
D.