Refer to the graphs shown. The effect of increased consumer income and higher production costs on a normal good is most likely shown in: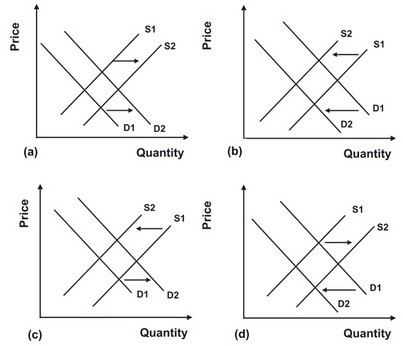
A. a.
B. b.
C. c.
D. d.
Answer: C
You might also like to view...
Every spring, motorists do more driving than during the winter months. Every spring, the price of gasoline increases and the motorists buy more gasoline. This experience suggests that the
A) "law of supply" does not always hold for necessities like gasoline. B) "law of demand" does not always hold for necessities like gasoline. C) laws of supply and demand are both contradicted for gasoline, though only during the spring driving season. D) None of the above answers are correct.
From 2009 to 2012
A) The Beveridge curve became flat. B) The Beveridge curve shifted to the right. C) The Beveridge curve cannot be discerned in the data. D) The Beveridge curve shifted to the left.
Exhibit 11-2 Aggregate demand and supply model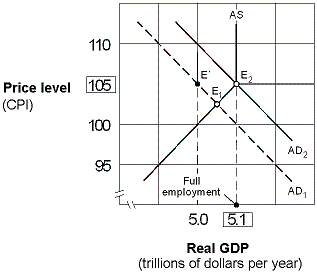 Suppose the economy in Exhibit 11-2 is in equilibrium at point E1 and the marginal propensity to consume (MPC) is 0.75. Following Keynesian economics, the federal government can move the economy to full employment at point E2 by:
A. decreasing government tax revenue by approximately $33 billion. B. decreasing government tax revenue by $750 billion. C. increasing government tax revenue by $100 billion. D. increasing government tax revenue by approximately $33 billion.
Critique the infant industry or the labor argument for protection
What will be an ideal response?