Find the indicated control limits.For a production process for which there is a great deal of data since its last modification, the population mean ? and the population standard deviation ? are assumed known. For such a process we have the following values for an R chart:  (The values of d2, D1, and D2 are found in the table of control chart factors).In a chalk-producing factory, after production, the length of six sample pieces of chalk is checked every 15 minutes. For this process, ? = 3.73 in. and ? = 0.15 in. Find the central line, UCL, and LCL for the range.
A. 0.380, 0.780, 0.031
B. 0.380, 0.762, 0.000
C. 0.406, 0.780, 0.031
D. 0.349, 0.738, 0.000
Answer: B
Mathematics
You might also like to view...
Factor and simplify the expression.
A. sin x B. sin x + 1 C. sin x - 1 D. cos2x
Mathematics
Determine whether the first number is divisible by the second number.1890; 18
A. Yes B. No
Mathematics
Graph the inequality.x + 2y ? 3
A. 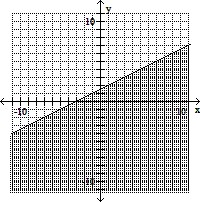
B. 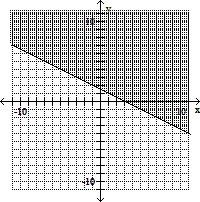
C. 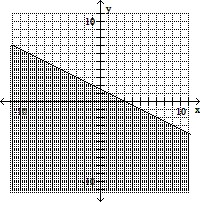
D. 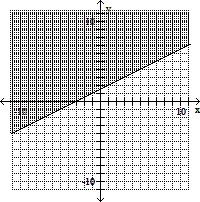
Mathematics
Solve the equation.625x = 125
A. 
B. 
C. 
D. 
Mathematics