?Select the most appropriate data display for the given situation:
?
The number of students at Fair Lane High School each year.
?
A. ?Bar Graph
B. ?Box-and-Whisker Plot
C. ?Line Plot
D. ?Line Graph
E. ?Circle Graph
Answer: D
You might also like to view...
Sketch the surface z = f(x,y).f(x, y) = 5 - y
A. 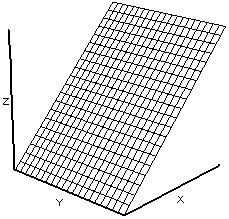
B. 
C. 
D. 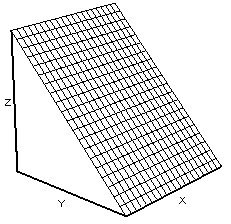
The NOT function is best implemented with ________.
a. amplifier b. oscillator c. inverter
Find the exact value. Do not use a calculator.sec 
A. - 
B. 
C. - 
D. -2
Solve the problem.The amount of a certain drug in the bloodstream is modeled by the function  , where y0 is the amount of the drug injected (in milligrams) and t is the elapsed time (in hours). Suppose that 10 milligrams are injected at 10:00 A.M. If a second injection is to be administered when there is 1 milligram of the drug present in the bloodstream, approximately when should the next dose be given? Express your answer to the nearest quarter hour.
A. 12:30 P.M B. 5: 30 P.M C. 5:45 P.M D. 3:45 P.M