Refer to the double-bar graph below which shows the number of male (M) and female (F) athletes at a university over a four-year period. Solve the problem. 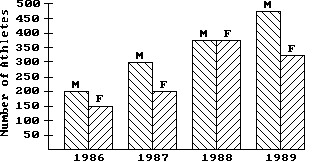 YEARWhat was the amount of the decrease in the number of female athletes from 1988 to 1989?
A. 75
B. 100
C. 200
D. 50
Answer: D
You might also like to view...
Solve the problem.Consider a retirement savings account where the monthly contribution is $125 for the first 15 years, is increased to $250 for the next 20 years, and then is increased once again to $300 for the last 5 years. The APR is always 6.0% compounded monthly. What is the value of the account at the end of 40 years? Round your answer to the nearest cent.
A. $339,049.09 B. $338,059.30 C. $343,032.07 D. $342,042.28 E. $335,066.11
Provide an appropriate response.Rewrite in exponential form: log6 216 = 3
What will be an ideal response?
Simplify the expression by using the order of operations.78 - 6 ? 5 ? 2
A. 65 B. 720 C. 96 D. 18
Solve the problem.Economists use what is called a Leffer curve to predict the government revenue for tax rates from 0% to 100%. Economists agree that the end points of the curve generate 0 revenue, but disagree on the tax rate that produces the maximum revenue. Suppose an economist produces this rational function 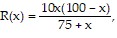 where R is revenue in millions at a tax rate of x percent. Use a graphing calculator to graph the function. What tax rate produces the maximum revenue? What is the maximum revenue?
A. 37.5%; $210 million B. 39.6%; $209 million C. 35.8%; $209 million D. 34.9%; $207 million