Refer to the double-bar graph below which shows the number of male and female athletes at a university over a four-year period. Solve the problem.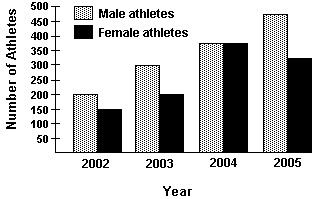 Find the increase in the number of male athletes from 2002 to 2004.
A. 125
B. 150
C. 175
D. 275
Answer: C
You might also like to view...
?In what way is a Pictograph more like a Bar Graph than a Histogram?
A. ?It shows frequency of data. B. ?It shows categorical information on the horizontal axis, while a histogram does not. C. ?It has a ledger to show scale of symbols/numbers used. D. ?a and b E. ?None of the above.
Use a calculator to evaluate the following expression. (Round your answer to three decimal places.)
?
 ?
?
A. 863.773 B. 893.773 C. 873.773 D. 3.137 × 10¹⁰ E. 883.773
Solve.The adult daily dosage for a certain medicine is 125 mg (milligrams) for every 20 pounds of body weight. If the patient weighs 240 pounds and he is to receive a dose of this medicine every 6 hours, find the amount of medicine he should receive in each dose.
A. 375 mg B. 9000 mg C. 6000 mg D. 250 mg
Determine the equation that expresses the statement.
F is directly proportional to x
Symbols a, b, c, d are constants.
 figure 1.png)