Use the following graph for a market to answer the question below.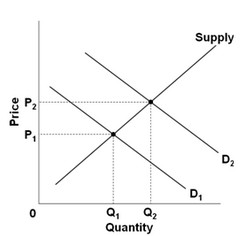 Which of the following could not explain the indicated increase in equilibrium price from P1 to P2?
A. an increase in production costs
B. an increase in consumer incomes
C. an increase in the price of a substitute product
D. a decrease in the price of a complementary product
Answer: A
You might also like to view...
A Prisoners Dilemma illustrates the fact that
a. Rational choices can lead to inefficient outcomes
b. Rational choices always leads to good outcomes
c. Rational choices always lead to inefficient outcomes
d. None of the above
A product is considered to be excludable if it is jointly owned by all members of a community
Indicate whether the statement is true or false
In 1940 _____ of the population over 25 had a college degree
a. less than 5 percent b. around 10 percent c. around 15 percent d. more than 20 percent
The above figure shows the cost curves for a competitive firm. If the firm is to operate in the short run, price must exceed
A) $0. B) $5. C) $10. D) $11.