Use the following graph of the bicycle market to answer the question below.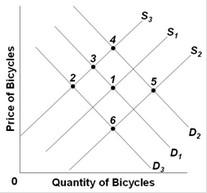 S1 and D1 are the original supply and demand curves. D2 and D3 and S2 and S3 are possible new demand and supply curves. Starting from the initial equilibrium (point 1), which point on the graph is most likely to be the new equilibrium after the introduction of technological improvements in bicycle production and successful publicity campaigns by the government on the virtues of bicycling to work?
A. 3
B. 4
C. 5
D. 6
Answer: C
You might also like to view...
There are no indisputable principles of tax equity
a. True b. False
Ryan Black does not work and has not looked for work because of a disability. He is:
a. a member of the civilian labor force who is employed. b. a member of the civilian labor force who is unemployed. c. a member of the civilian labor force who is underemployed. d. a discouraged worker who is not a member of the labor force. e. not a member of the labor force.
Which of the following would provide the best evidence that a commodity is being produced under conditions of perfect competition?
A) The supply curve is perfectly inelastic. B) The demand curve facing any one producer is perfectly elastic. C) The production of the commodity is large. D) The profits of producers are low.
Opportunity cost is
A. the additional cost of producing an additional unit of output. B. that which we forgo, or give up, when we make a choice or a decision. C. the additional cost of buying an additional unit of a product. D. a cost that cannot be avoided, regardless of what is done in the future.