Refer to the graphs shown. The arrow that best shows an increase in supply is: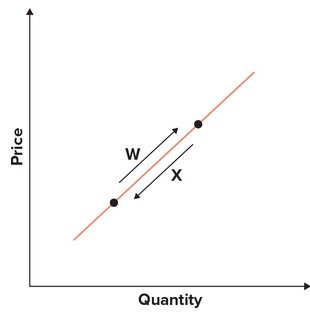
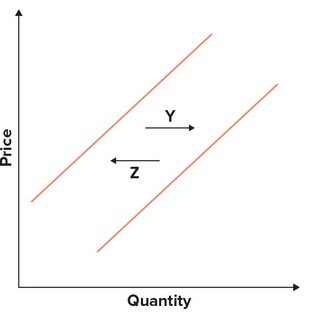
A. W.
B. X.
C. Y.
D. Z.
Answer: C
You might also like to view...
Hutch Technology makes computer monitors, which sell for $100 each. What is the opportunity cost of 10 monitors?
A. $1,000 B. The other goods that could be produced with the resources that produce the 10 monitors C. The profits that Hutch earns when 10 monitors are sold D. The lost profits that Hutch if the monitors are not produced E. All of the responses are correct.
Transforming the tax base of an income tax by subtracting savings has the advantage that _____
a. a progressive rate structure can be applied to a consumption tax b. all income can be taxed at a flat rate c. it double taxes income d. it guarantees progressivity
This table shows individual demand schedules for a market.
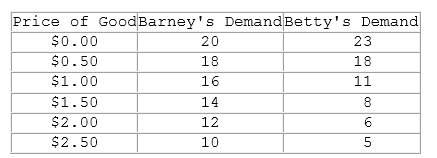
According to the table shown, what can be said of Betty and Barney's demand for this good?
A. Betty's and Barney's demand both follow the law of demand.
B. Barney's demand follows the law of demand, but Betty's does not.
C. Betty's demand follows the law of demand, but Barney's does not.
D. Neither Betty's nor Barney's demand follows the law of demand.
The most severe depression in the United States was the 30 percent decrease in real GDP that occurred between
a. 1899 and 1913. b. 1929 and 1933. c. 1959 and 1963. d. 1979 and 1983.