The graph below shows the net income, in billions of dollars, for the Ford Motor Company for the years 2001 through 2005. How much greater was the increase in net income from 2001 to 2003 than from 2002 to 2004?
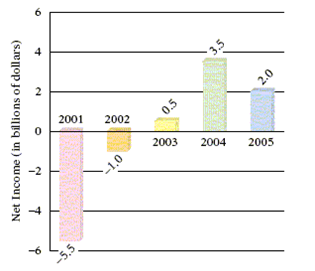
A) $3.5 billion
B) $6.0 billion
C) –$3.5 billion
D) –$6.0 billion
E) $4.5 billion
A) $3.5 billion
Mathematics
You might also like to view...
Graph the solution of the system of linear inequalities.
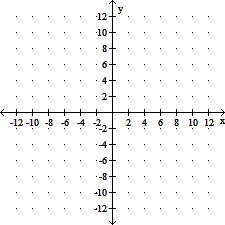
A. 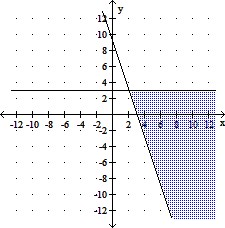
B. 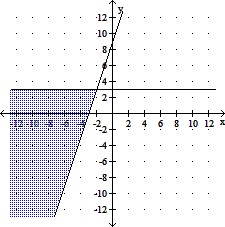
C. 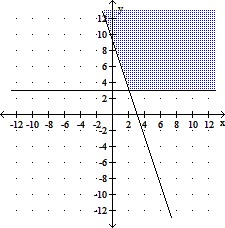
D. 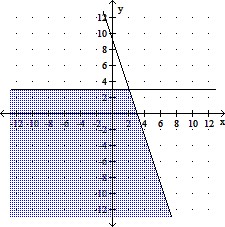
Mathematics
Factor the polynomial completely.11x2 + 122x + 11
A. prime B. (11x - 1)(x - 11) C. (11x + 1)(x + 11) D. (11x + 11)(x + 1)
Mathematics
Solve the problem.A theater has 26 rows with 23 seats in the first row, 28 in the second row, 33 in the third row, and so forth. How many seats are in the theater?
A. 4446 seats B. 2223 seats C. 4576 seats D. 2288 seats
Mathematics
Find the center and radius and draw the graph.(x + 5)2 + (y - 5)2 = 4
A. 
center (-5, 5); radius 2
B. 
center (5, 5); radius 2
C. 
center (5, -5); radius 2
D. 
center (-5, -5); radius 2
Mathematics