Refer to Figure 5.1. In which graph does a shift from BL1 to BL2 represent an increase in the consumer's income?
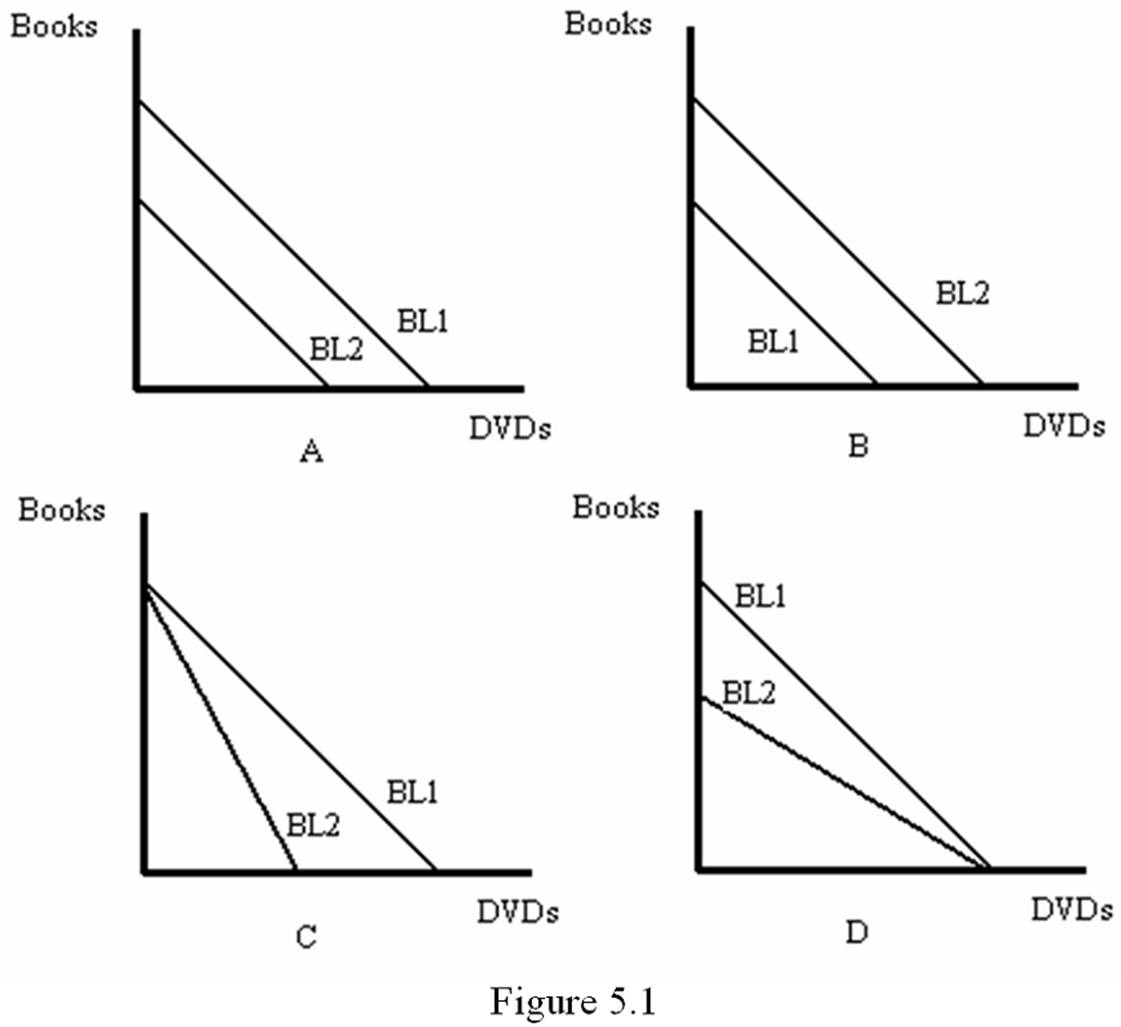
A. A
B. B
C. C
D. D
B. B
You might also like to view...
Assume goods X and Y are complements. A decrease in the price of X would cause the demand for Y to increase
Indicate whether the statement is true or false
A bank receives a demand deposit of $1,000 . The bank loans out $600 of this deposit and increases its excess reserves by $300 . What is the legal reserve requirement?
a. 10 percent b. 20 percent c. 30 percent d. 60 percent
The employee is thinking like an entrepreneur in which of the following situations?
What will be an ideal response?
Which of the following will cause the demand curve for a good to shift to the right?
A. Decrease in income for a normal good. B. Increase in the price of a complementary good. C. Decrease in the price of the good. D. Increase in the price of a substitute good.