In the four-quadrant diagram of the specific factors model, the graph in the upper left quadrant is a country's
A) production function for food.
B) production possibility frontier.
C) labor allocation constraint.
D) production function for cloth.
E) labor supply curve.
A
You might also like to view...
If the market supply curve and market demand curve for a good intersect at 600,000 units and there are 10,000 identical firms in the market, then each firm is producing
A) 600,000 units. B) 60,000,000,000 units. C) 60,000 units. D) 60 units. E) 10,000 units.
Holding the nonprice determinants of demand constant, a change in price would
a. result in either a decrease in demand or an increase in demand. b. result in a movement along a stationary demand curve. c. result in a shift of supply. d. have no effect on the quantity demanded.
Using Figure 1 above, if the aggregate demand curve shifts from AD2 to AD3 the result in the short run would be: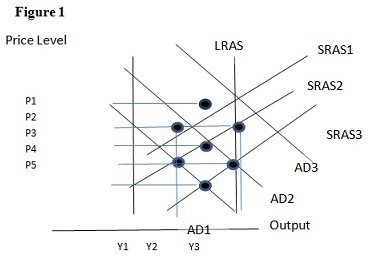
A. P1 and Y2. B. P2 and Y3. C. P3 and Y1. D. P2 and Y2.
If the marginal product of labor equals the average product of labor, then the
A. marginal product is still increasing. B. average product is maximized. C. average product is still increasing. D. marginal product is maximized.