Using Figure 1 above, if the aggregate demand curve shifts from AD1 to AD2 the result in the long run would be: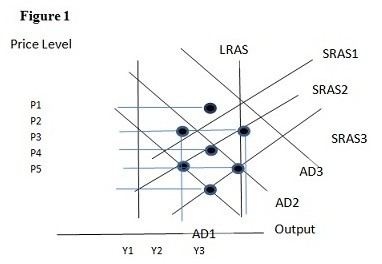
A. P1 and Y2.
B. P2 and Y2.
C. P3 and Y1.
D. P2 and Y3.
Answer: D
You might also like to view...
According to the graph shown, the equilibrium price is ______ and equilibrium quantity is ____.

According to the graph shown, the equilibrium price is ______ and equilibrium quantity is ____.
A. $5; 30
B. $10; 20
C. $20; 10
D. $15; 30
In a perfectly competitive industry, the industry demand curve is ____, while in a monopolistic industry, the industry demand curve is:
a. horizontal; downward sloping b. downward sloping; horizontal. c. downward sloping; downward sloping. d. horizontal; horizontal.
If a perfectly competitive firm raises its price,
a. the quantity demanded of its good falls because the firm faces a downward- sloping demand curve b. the quantity demanded of its good falls to zero c. new firms will enter, attracted by the higher price d. it loses some of its market share e. other firms in the industry must follow the leader
Which statement is false?
A. All oligopolies have only a few firms. B. Most firms in the United States are oligopolies. C. Administered prices are most likely to occur under oligopoly. D. In all market structures, price is always read off the demand curve.