The following line graph represents data pertaining to water flows over a dam. Use the graph to answer the following question(s).
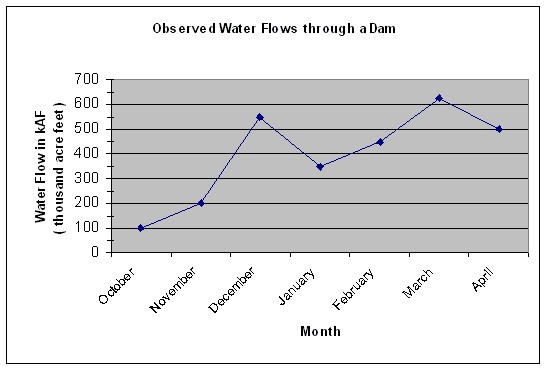 During which months did the flow decrease?
A. October to November and February to March
B. December to January and February to March
C. October to November and March to April
D. December to January and March to April
Answer: D
You might also like to view...
Solve the problem.Suppose that R ={(x, y): 0 ? x ? 7, 0 ? y ? 7},R1 = {(x, y): 0 ? x ? 7, 0 ? y ? 6}, andR2 = {(x, y): 0 ? x ? 7, 6 ? y ? 7}. Suppose, in addition, that dA = 7,
  dA = 9, and
  dA = 2.Use the properties of integrals to evaluate
  dA.
dA.
A. 9 B. 18 C. 11 D. 7
Evaluate the line integral along the curve C. ds , C is the path from (0, 0, 0) to (-4, 4, 1) given by:C1: r(t) = -4t2i + 4tj, 0 ? t ? 1C2: r(t) = -4i + 4j + (t-1)k, 1 ? t ? 2
A. 
 -
- 
B. 
C. 
D. 
 +
+ 
Find the center of mass of a thin plate covering the given region with the given density function.The region bounded by x = y2 and the line x = 16, with density ?(x) = y2
A.  =
=  ,
,  = 0
= 0
B.  =
=  ,
,  = 0
= 0
C.  =
=  ,
,  = 0
= 0
D.  = 0,
= 0,  =
= 
Find the indicated sum.-2, 4, 10, 16, 22, . . . ; S5
A. 130 B. 82 C. 50 D. -10