Listed in the above table are the total revenues for the firms in two different industries. Each industry has only eleven firms. Find the four-firm concentration ratio and the Herfindahl-Hirschman Index for each industry
What will be an ideal response?
Industry A has a four-firm concentration ratio of 59 percent and a Herfindahl-Hirschman Index of 1,186. Industry B has a four-firm concentration ratio of 39 percent and Herfindahl-Hirschman Index of 914.
You might also like to view...
"We offer the best deal in town. If somebody charges a lower price, bring in their ad and we'll beat it!" From the economic point of view, the firm promising to match its competitor's low prices is attempting to
A) lie. B) cheat. C) learn more about the market. D) do nothing more than bait and switch their customers.
A perfectly competitive firm that is producing a positive quantity of a good maximizes its economic profit if it produces so that
A) total revenue = total cost. B) marginal revenue = marginal cost. C) average revenue = average total cost. D) average total cost = average variable cost.
Using Figure 1 above, if the aggregate demand curve shifts from AD3 to AD2 the result in the long run would be: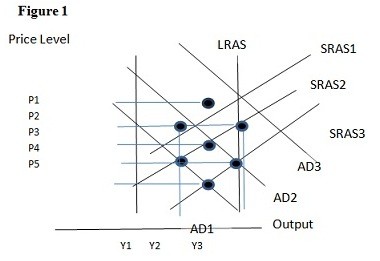
A. P1 and Y2. B. P2 and Y1. C. P3 and Y1. D. P3 and Y2.
The number of workers employed will not change as a result of an increase in productivity when which of the following occurs?
A) The AS curve shifts downward. B) Output growth exceeds productivity growth. C) Productivity growth is equal to output growth. D) The AD curve shifts to the right. E) none of the above