Refer to the figure below.________ inflation will eventually move the economy pictured in the diagram from short-run equilibrium at point ________ to long-run equilibrium at point ________. 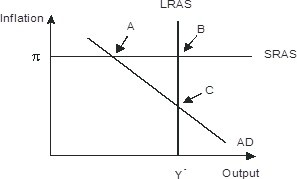
A. Rising; A
B. Falling; A; C
C. Falling; B: C
D. Rising; A; C
Answer: B
You might also like to view...
Demand for a product is given by Q = 100 - P and supply is given by Q = P - 10. If the quantity demanded rises by 10 units at every possible price, then the equilibrium price will
a. increase by $5 b. increase by $10 c. decrease by $5 d. increase by $7.50
Use the following table to answer the next question.YearAltaZornAltaZorn?(Real GDP)(Real GDP)(Population)(Population)1$2,000$150,00020050022,100152,00020250532,200154,000210508Per capita GDP was about
A. $303 in year 3 in Zorn. B. $5 in year 2 in Alta. C. $105 in year 3 in Alta. D. $200 in year 1 in Zorn.
Congress established the FOMC because
A) a group was needed to set reserve requirements for member banks. B) of a lack of coordination among district banks in carrying out open market operations. C) Congress was attempting to expand its influence within the Federal Reserve System. D) a group was needed to coordinate the setting of discount rates by the district banks.
Examples of incentive pay include
a. allowing employees a certain number of personal days b. providing onsite parking for employees c. cleaning the worksite with weekly janitorial service d. prizes to the employee team to win a project goal tournament